Observability vs Monitoring: When Dashboards Fall Short
Checkout latency climbs from 400 ms to 3 seconds for a slice of customers. The error rate is flat, CPU is flat, every health check is green, and the dashboards the team built after the last incident show nothing wrong. Support has twelve tickets, and nobody can say which customers, which dependency or which release. This is the practical edge of observability vs monitoring: monitoring answers the questions you wrote down in advance, and observability is what lets you ask a question you did not anticipate without shipping new code first. The rest is a practical path from that difference to the smallest .NET setup that proves its value.
Observability vs Monitoring: What Is the Difference?
Monitoring is watching a fixed set of signals against known thresholds, so it tells you that something you predicted has happened. Observability is a property of the system: it emits enough correlated, detailed data that you can work out why something is happening, including failures nobody predicted. OpenTelemetry's own primer defines it as something that "lets you understand a system from the outside by letting you ask questions about that system". The test is operational. If answering a new question means adding a log line and deploying, you have monitoring. If you can answer it from data already emitted, you have observability.
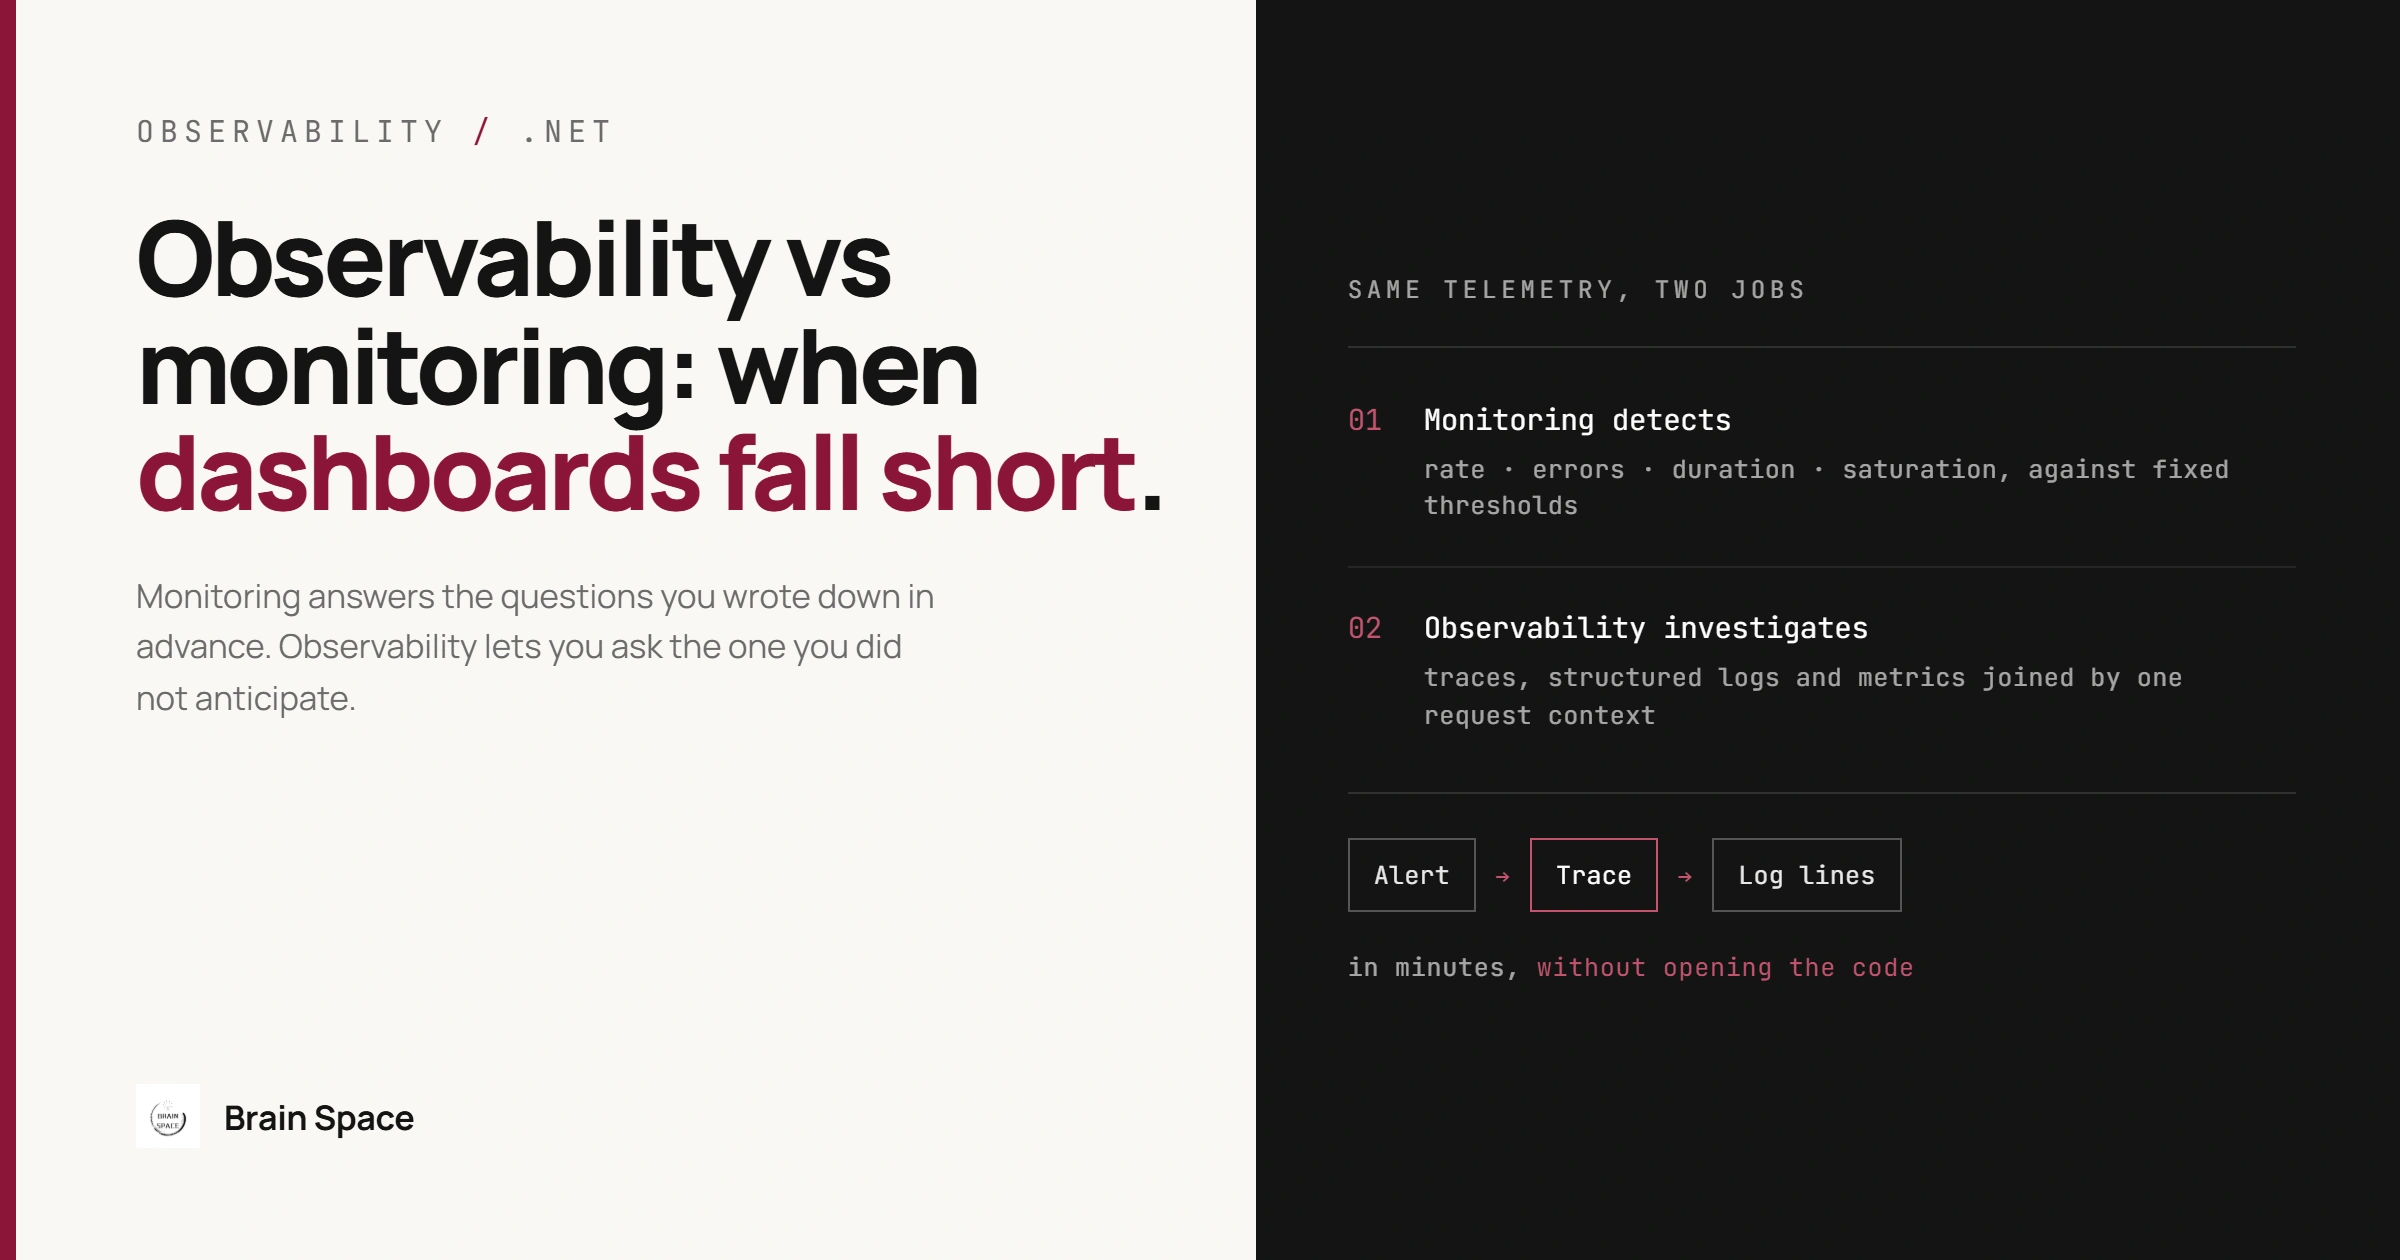
The two are not rivals. Alerts on error rate, saturation and latency are still the right way to find out that something is wrong, and observability data is what you open once the alert fires. Monitoring detects, observability investigates, and both draw on the same telemetry.
| Dimension | Monitoring | Observability |
|---|---|---|
| Questions | Fixed in advance, as dashboards and alert rules | Chosen during the incident |
| Typical signals | Request rate, error rate, duration, saturation | Traces, structured logs and metrics joined by one request context |
| Finds | Known failure conditions | Unanticipated causes inside a request path |
| Cost driver | Number of panels and alerts to maintain | Telemetry volume, cardinality and instrumentation upkeep |
When Monitoring Is Enough
A system with one deployable unit, one database and a handful of dependencies often does not need more. A request-rate, error-rate and duration dashboard plus searchable logs cover its failure modes, and distributed tracing buys little because there is no network hop to hide time in. The same holds for a well-bounded modular monolith. The common mistake is adopting the full stack because the architecture diagram looks distributed. The consequence is a bill and an instrumentation maintenance burden for questions the team was never going to ask.
Why Dashboards Stop Working as Systems Grow
A dashboard is a set of questions chosen in advance, and every question implies a failure you already imagined. That works while failures repeat. It stops working when a request crosses several services, a queue and a database, because the failure becomes a combination: one tenant, one payment provider, one retry policy and one release, all at once. No predefined panel slices by that combination.
In the opening scenario, the slow checkouts all go through a call to an external payment provider that started returning slowly for one card type, and the HTTP client retries it twice. Averages hide this. A latency percentile panel shows a bump but not the cause, which lives in individual requests: which dependency span took the time, how many retries happened inside it, which customers were affected. Teams usually discover this after the second incident that needed an emergency deploy to add logging. A 99.9% uptime commitment, the kind we operate under on the multi-country Azure platform in our portfolio, leaves roughly 43 minutes of downtime a month, and every redeploy to add a log line during an incident spends part of it.
What Has to Change in the System, Not the Tooling
Buying a platform does not make a system observable.The system has to emit telemetry that can be joined, and that comes down to three engineering decisions: carry one context through every hop, put each detail in the signal that can afford it, and make logs structured.
Carry One Trace Context Across Every Hop
A trace records the path of a single request, and its value comes from the identifier that ties spans from different processes together. Without that shared identifier, spans from different services are only a list of unrelated timings. In .NET the default ID format is the W3C TraceContext standard (since .NET 5), and ASP.NET Core and HttpClient encode and decode it on HTTP messages with no code from you. The gap is everything that is not HTTP. The same documentation says third-party libraries may add support for non-HTTP message protocols, which means you cannot assume your queue client does.
The common mistake is instrumenting HTTP and leaving queues alone. The consequence is a trace that ends at the publisher and a second, unrelated trace that starts at the consumer, so the slowest part of an asynchronous workflow, the time a message waited, is invisible. None of this matters for a system whose calls all stay in one process, where there is no hop to carry a context across. The check takes ten minutes: publish one message in a test environment and confirm the consumer's span carries the publisher's trace ID. If it does not, propagate the context in message headers yourself, or note on the runbook that asynchronous paths are not covered.
Put Each Detail in the Signal That Can Afford It
Logs, metrics and traces are not interchangeable. Metrics are aggregations over time, cheap to store and fast to alert on, but every distinct combination of attribute values creates a new time series. Traces and logs hold per-request detail and can carry an order ID. The OpenTelemetry .NET SDK applies a default cardinality limit of 2000 per metric, adjustable per metric through a view (MetricStreamConfiguration.CardinalityLimit). As of SDK 1.10.0, once a metric reaches it, measurements that cannot be aggregated independently are folded into an overflow point. The common mistake is putting an identifier that grows with your data, such as customer or order ID, on a metric. A metric labeled by customer ID does not fail loudly. Totals stay correct, but the per-customer breakdown quietly stops for every customer beyond the limit, and the same page warns that cardinality explosion raises observability costs.
Splitting detail this way keeps metric cost and accuracy predictable while per-request detail stays available on spans. For a small service with a handful of tenants the discipline is overkill: a tenant label stays far below the limit, and the rule starts to matter once an attribute grows with your customers or orders. The rule that follows: low-cardinality dimensions such as payment method or HTTP route on metrics, high-cardinality identifiers such as order ID on spans. The same page advises against putting TraceId and SpanId on metrics and points to exemplars for linking a metric to a trace. The sample below follows this split. It assumes the ASP.NET Core, Http and SqlClient instrumentation packages and the OTLP exporter package that Microsoft's .NET OpenTelemetry guide lists, plus OpenTelemetry.Extensions.Hosting, which provides AddOpenTelemetry (see that package's README; it is not in Microsoft's table). Data goes over OTLP to whichever backend the standard OpenTelemetry environment variables point at.
using System.Diagnostics;
using System.Diagnostics.Metrics;
using OpenTelemetry.Logs;
using OpenTelemetry.Metrics;
using OpenTelemetry.Resources;
using OpenTelemetry.Trace;

var builder = WebApplication.CreateBuilder(args);

builder.Services.AddOpenTelemetry()
    .ConfigureResource(r => r.AddService("orders-api"))
    .WithTracing(t => t
        .AddAspNetCoreInstrumentation()
        .AddHttpClientInstrumentation()
        .AddSqlClientInstrumentation()
        .AddSource(OrderTelemetry.Name)
        .AddOtlpExporter())
    .WithMetrics(m => m
        .AddAspNetCoreInstrumentation()
        .AddMeter(OrderTelemetry.Name)
        .AddOtlpExporter());

// Logs go through ILogger; the OpenTelemetry provider exports them over OTLP.
builder.Logging.AddOpenTelemetry(l => l.AddOtlpExporter());

public static class OrderTelemetry
{
    public const string Name = "Orders";
    public static readonly ActivitySource Source = new(Name);
    static readonly Meter Meter = new(Name);
    static readonly Counter<long> Placed = Meter.CreateCounter<long>("orders.placed");

    public static async Task PlaceOrderAsync(Order order, ILogger log, Func<Task> work)
    {
        using var activity = Source.StartActivity("PlaceOrder");

        // High cardinality: fine on a span, never on a metric.
        activity?.SetTag("order.id", order.Id);
        activity?.SetTag("tenant.id", order.TenantId);

        await work();

        // Low cardinality: a small, fixed set of values.
        Placed.Add(1, new KeyValuePair<string, object?>("payment.method", order.PaymentMethod));

        // Message template, not interpolation: OrderId stays a queryable field.
        log.LogInformation("Order {OrderId} placed", order.Id);
    }
}
The names passed to AddSource and AddMeter must match the ones the code creates, or nothing is collected.A mismatch there is a typical reason a custom span "does not show up".
Make Logs Structured and Joinable
Logs become part of the same investigation when they carry the trace and span ID of the request that wrote them. In .NET that means sending logs through ILogger with the OpenTelemetry provider, as in the last lines of the setup above, which exports them over OTLP; see the OpenTelemetry .NET logs documentation for correlation details. The OpenTelemetry logs specification includes TraceId and SpanId in log records where possible, which lets you jump from a slow span to the exact log lines written during it. This only works if the log arguments stay fields. .NET's message templates pass the arguments to the logging provider as values rather than only a formatted string, while string interpolation flattens them into text, so LogWarning("Payment retry {Attempt} for {OrderId}", attempt, id) is queryable and LogWarning($"Payment retry {attempt} for {id}") is not. The mistake costs you during the incident: a search for every retry of one order returns nothing structured, and you fall back to grepping text across instances. If logs are only ever read by a person tailing a single instance, structure adds little; it pays once you search across instances or join logs to traces. Centralizing logs without a correlation key is the older version of the same mistake: you get one searchable pile and no way to isolate a single request from it.
What Observability Costs and How to Control It
Observability is not free: there is instrumentation to keep current, ingestion priced by volume, and cardinality that grows without anyone deciding it. Per-request detail gets expensive as traffic grows, which is why sampling exists.
Head Sampling and Tail Sampling Trade Different Things
Head sampling decides whether to keep a trace at the start, for example keeping 5%. It is simple and cheap, but per the OpenTelemetry sampling guide it cannot base the decision on the rest of the trace, so it cannot guarantee that traces containing errors are kept. Tail sampling decides after seeing the spans, so it can keep every error and every slow trace. The cost is operational: the guide describes tail-sampling components as stateful systems that must accept and store a large amount of data, needing substantial compute at high traffic and their own monitoring, and says tail samplers often end up vendor-specific.
For a mid-size team: start without sampling, watch what ingestion volume and the bill actually do, and sample only when they force you to. Starting at 5% head sampling feels prudent and defeats the purpose, because the rare slow request you installed tracing to explain is exactly the one that gets dropped. If you reach tail sampling, budget it as a service you operate, not a setting. Telemetry spend also belongs in your wider cost plan; our Azure cost optimization sequence puts it last, after ownership, right-sizing and commitments, for that reason.
How to Tell You Have Outgrown Dashboards
The useful signal is not the architecture diagram but the incident history. You have outgrown monitoring alone when a root cause needed a deploy to add logging before it could be found, when customers report problems while every panel is green, when a request crosses more than two or three services or queues and nobody can say where its time goes, or when an alert fires and the on-call engineer cannot tell which dependency is responsible. One of these is an annoyance. If two show up in the same quarter, treat it as a pattern.
The opposite anti-pattern is adding observability before there is a diagnostic problem and building dashboards with no actionable signal. Distributed tracing becomes valuable when the system's failure modes can no longer be diagnosed reliably from service-level metrics and logs, and not before.
The Smallest Useful Implementation
Prove the diagnostic value on one path, then widen.
- Pick the single request path that costs you the most when it is slow or failing, typically checkout, login or a core API call.
- Enable automatic instrumentation for ASP.NET Core,
HttpClientand SqlClient, and export over OTLP to one backend. If you are on .NET and starting from nothing, Microsoft's guide describes reusing the Aspire Service Defaults project without the rest of Aspire: rundotnet new aspire-servicedefaults, reference the project and callbuilder.ConfigureOpenTelemetry(). The template includes the SDK plus ASP.NET Core, HttpClient and runtime instrumentation, so add SqlClient yourself, and set the standard OpenTelemetry environment variables to point the OTLP exporter at your backend. Azure Monitor and Prometheus with Grafana both accept OpenTelemetry data, so the choice of backend does not lock in your instrumentation. - Add one custom span at the business step that matters, with two or three identifying attributes on the span and none on metrics.
- Confirm that logs carry the trace ID and, if the path uses a queue, that the consumer joins the publisher's trace.
- Run a drill: take one real slow request and go from alert to trace to the log lines in minutes, without opening the code. If you cannot, fix that before adding more services.
Measure it with the share of incidents whose cause was found without a redeploy, and the time from alert to identified dependency. Widen only after the drill works.
Questions Teams Ask About Observability vs Monitoring
Does observability replace monitoring?
No. Alerting on known failure conditions is still how you learn something is wrong quickly. Observability changes what you can do after the alert: investigate an unanticipated cause from data you already collected.
Do I need OpenTelemetry to be observable?
No, but it avoids a decision you would regret. In .NET it collects from the built-in ILogger, Meter and ActivitySource APIs and exports over a vendor-neutral protocol, so switching backends does not mean re-instrumenting. A proprietary agent can work too, at the price of tying the instrumentation to one vendor.
Is distributed tracing worth it for a monolith?
Rarely as a first step. A monolith with one database mostly needs structured logs and request metrics. Tracing pays for itself once requests leave the process through HTTP calls, queues or several data stores, and database spans alone can justify it if slow queries are your recurring incident.
Decision Rule: Instrument the Question You Cannot Answer Yet
Start from the last incident that was slow to explain, write down the question that would have shortened it, and instrument just enough to answer that question from data you already collect. Prove it on one path, check that context survives the queue, keep detail on spans and low-cardinality values on metrics, and sample only when the bill forces it. If your platform spans several services and incidents keep ending in "we needed more logging", that is where our cloud and DevOps engineering work usually begins, alongside the architecture of the distributed system itself.